Kube Eagle on ORACLE Kubernetes Engine

Saiyam is working at Loft as a Principal Developer Advocate. Previously, at Walmart Labs, Oracle, and HP, Saiyam has worked on many facets of k8s, including the machine learning platform, scaling, multi-cloud, managed k8s services, and k8s documentation. He's worked on implementing Kubernetes solutions in different organizations. When not coding, Saiyam works on contributing to the community by writing blogs and organizing local meetups for Kubernetes and CNCF. He is also a Kubestronaut/Portainer/Traefik/CNCF ambassador and can be reached on Twitter @saiyampathak.
Everybody is aware or at least heard of of Prometheus and Grafana which is the most widely used tools for monitoring the kubernetes cluster and the most common metrics collection happens is via the Node Exporter or the Kube State metrics. But the problem with these metrics is that they are a bit complex to understand and analyse . They do not have enough metadata and aggregation of both the metric collection tools become difficult. Recently I came across a project called Kube Eagle. It is an open source project for monitoring of the kubernetes cluster but it has some of the added advantages to the current monitoring metrics out there as I have mentioned above . So in this post I will show you how to configure Kube Eagle for Oracle Kubernetes Engine which can be extended to any other kubernetes cluster as well.
So before directly jumping onto the installation steps for Kube Eagle lets understand what it is used for specifically over the other metrics that are already there. Kube Eagle is meant for kubernetes cluster monitoring even upto 50 nodes and above per cluster and can track very curated information about the nodes which can help to save money . Using kubernetes cluster is great but what matters today is using it resourcefully meaning knowing how much memory to allocate to a resource so that the costs are controlled and in the end what matters in cloud is cost savings.
The repository for Kube Eagle : https://github.com/google-cloud-tools/kube-eagle
Let us See how we can install this on Oracle Kubernetes Cluster. Before moving further you need to have a cluster up and running, kubectl installed (if not then download it from https://storage.googleapis.com/kubernetes-release/release/v1.13.0/bin/windows/amd64/kubectl.exe) and the kube-config file properly configured for the Oracle kubernetes Cluster. When you do “kubetclt get nodes” it should give you the nodes from the configured cluster.
If you have set up a Oracle kubernetes cluster you need to go though the following steps (All the steps I will be mentioning is for a Windows system ) : Installing Metrics server:
- Clone the repository using git bash in you local system : https://github.com/kubernetes-incubator/metrics-server
- In order to deploy metrics-server in your cluster run the following command from the top-level directory of this repository: kubectl create -f deploy/1.7/ (for kubernetes 1.7) kubectl create -f deploy/1.8/ (for kubernetes 1.8) Now if you do “kubectl get pods -n kube-system” you will see metrics server running

Make sure that you have metrics server running .
Installing Chocolatey for windows 10 : you can simply open powershell as administrator and run the commands as mentions in the documentation : https://chocolatey.org/docs/installation .
Now that Chocolatey is installed we will install helm using it . choco install kubernetes-helm Alternatively you can download the desired version:https://github.com/helm/helm/releases and then extract the zip file and add to path in environment variables.

Now that you have helm in you system locally you need to configure a service account for Tiller :
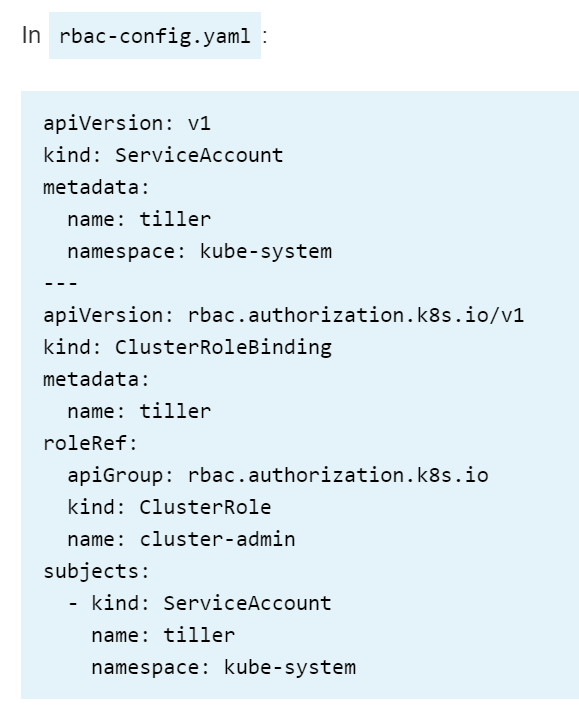 Service account creation
once you create the above file then you run : $ kubectl create -f rbac-config.yaml serviceaccount “tiller” created clusterrolebinding “tiller” created $ helm init — service-account tiller you can check helm version :

you will also see tiller pod running in the kube-system namespace

Once helm is initialized you can use helm for the installation of Prometheus, Grafana and Kube Eagle using the Helm Charts.
Since this post is about Kube-Eagle so I will not be explaining in and out of prometheus and grafana for that I have already written separate posts. But we will do a local installation of prometheus and grafana and access the dashboards locally from windows system using helm.
Installing Prometheus and Grafana: Prometheus: helm install — name prometheus stable/prometheus In order to run Prometheus locally and see the UI run the following commands : $ export POD_NAME=$(kubectl get pods --namespace default -l “app=prometheus,component=server” -o jsonpath=”{.items[0].metadata.name}”) $ kubectl --namespace default port-forward $POD_NAME 9090
above will install the stable version of prometheus and run it on http://localhost:9090
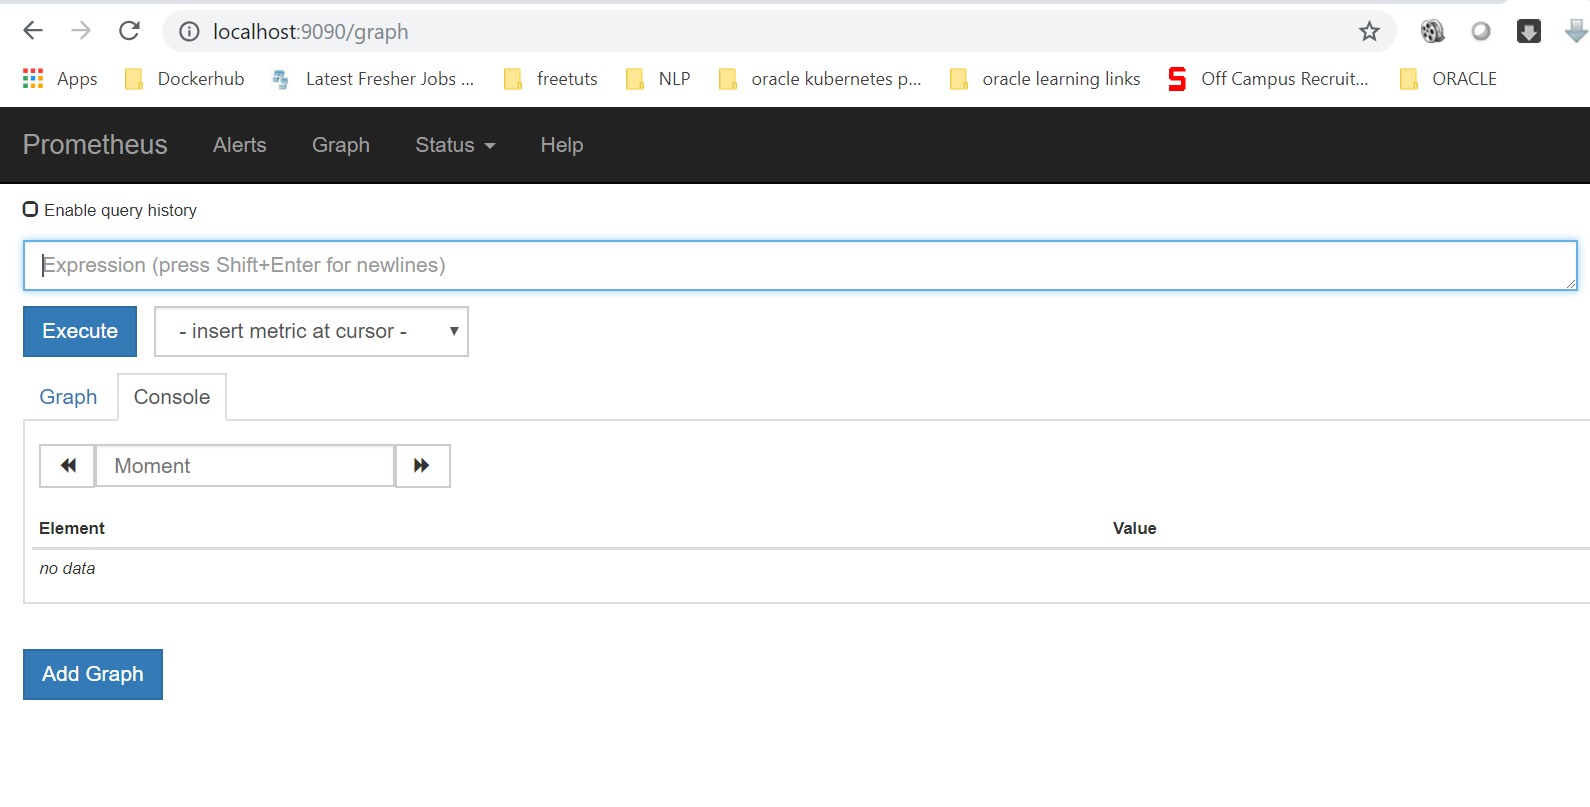 Prometheus UI
Grafana :

helm install — name grafana stable/grafana In order to run Grafana locally and see the Dashboard run the following commands : $ export POD_NAME=$(kubectl get pods --namespace default -l “app=grafana” -o jsonpath=”{.items[0].metadata.name}”) $ kubectl --namespace default port-forward $POD_NAME 3000
above will install the stable version of grafana and run it on http://localhost:3000
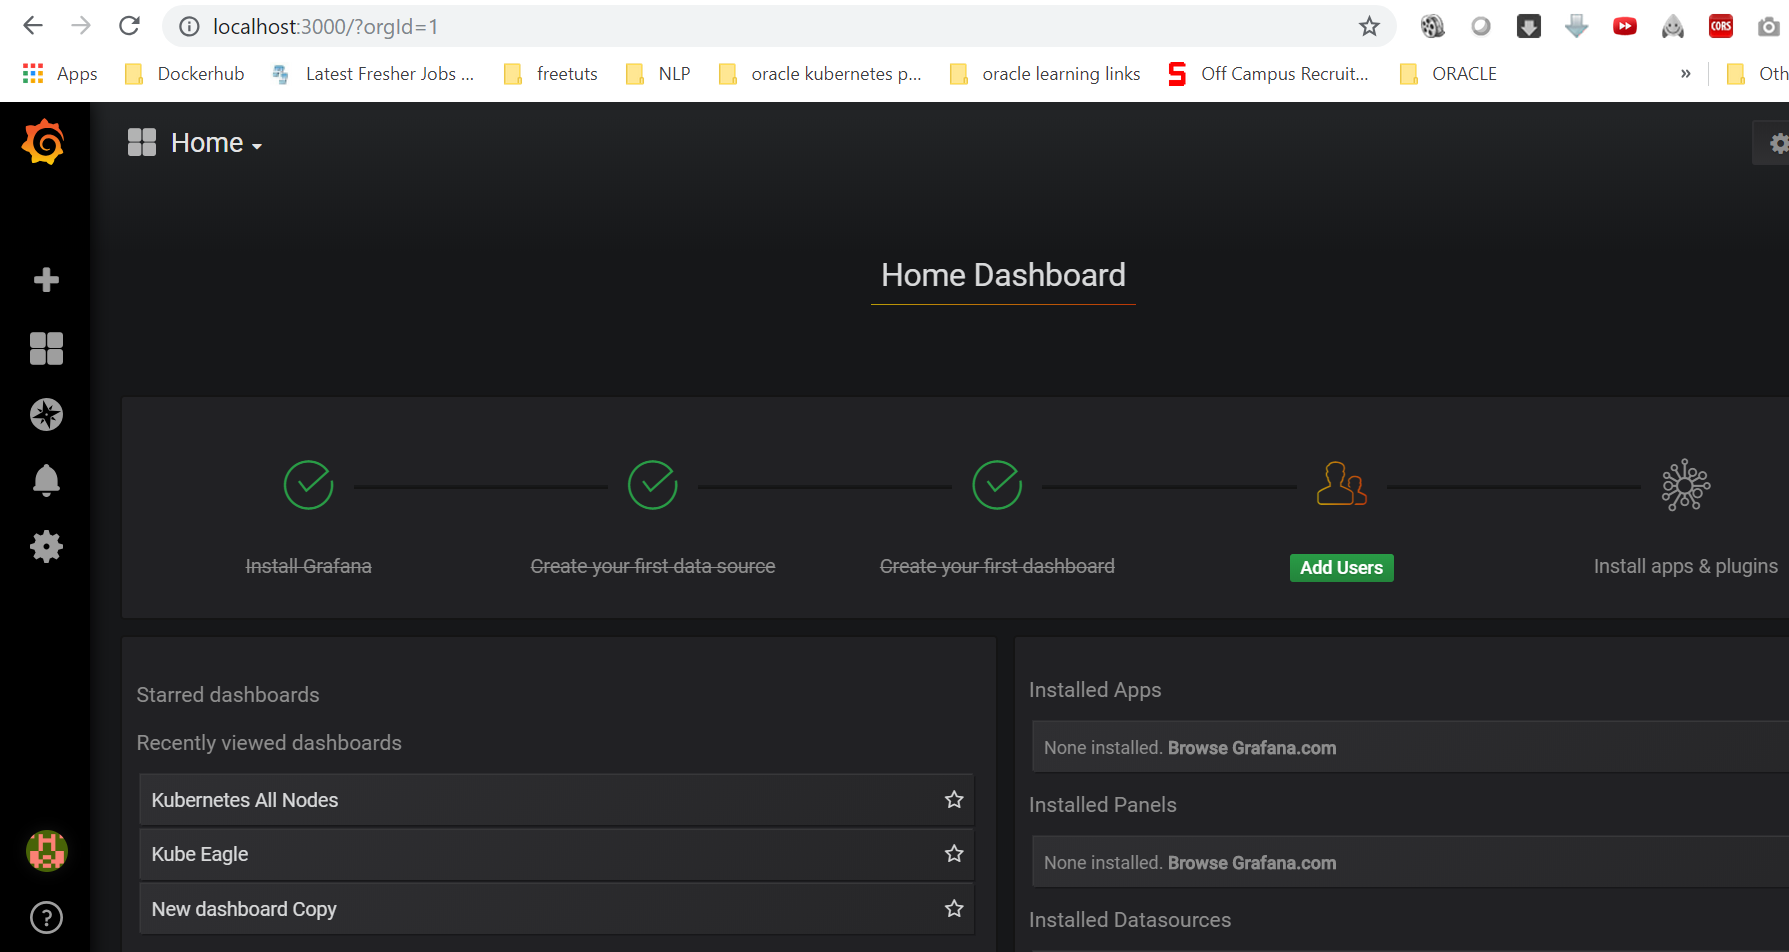 Grafana Dashboard
Now we have everything setup in order to run Kube-Eagle lets go ahead and install Kube-Eagle using helm: repo : https://github.com/google-cloud-tools/kube-eagle-helm-chart steps: -helm repo add kube-eagle https://raw.githubusercontent.com/google-cloud-tools/kube-eagle-helm-chart/master -helm repo update -helm install --name=kube-eagle kube-eagle/kube-eagle
Above will install Kube-Eagle and you can see it running in the default namespace:

NOTE: Since you have installed Prometheus and Grafana you will be seeing the pods coming up for them in the default namespace as well :
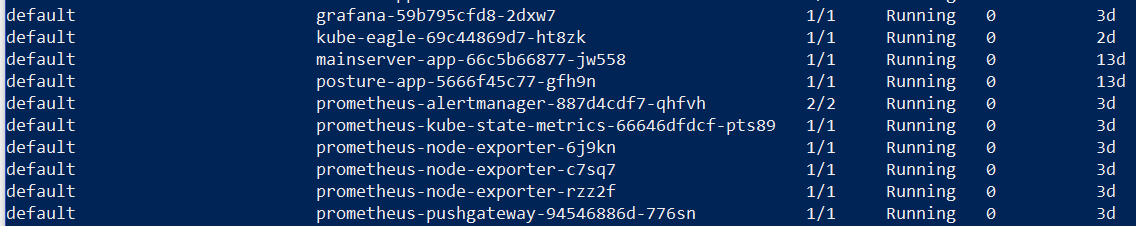 Prometheus and Grafana PODS
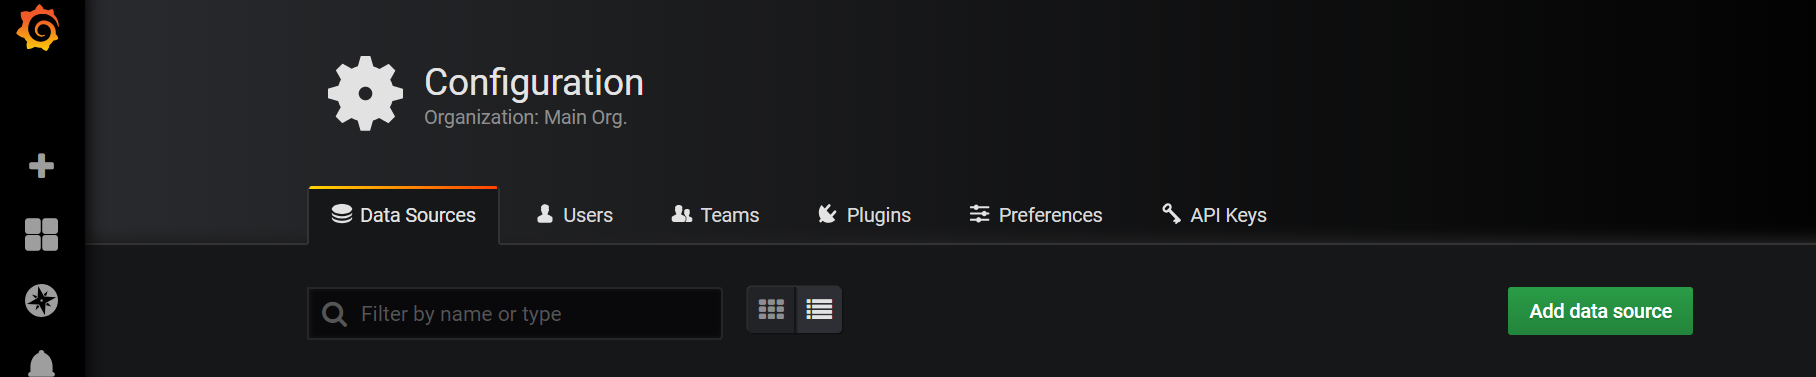
Since we have everything setup lets add prometheus as a data source in grafana : Go to Configuration from the dashboard and click add data source.
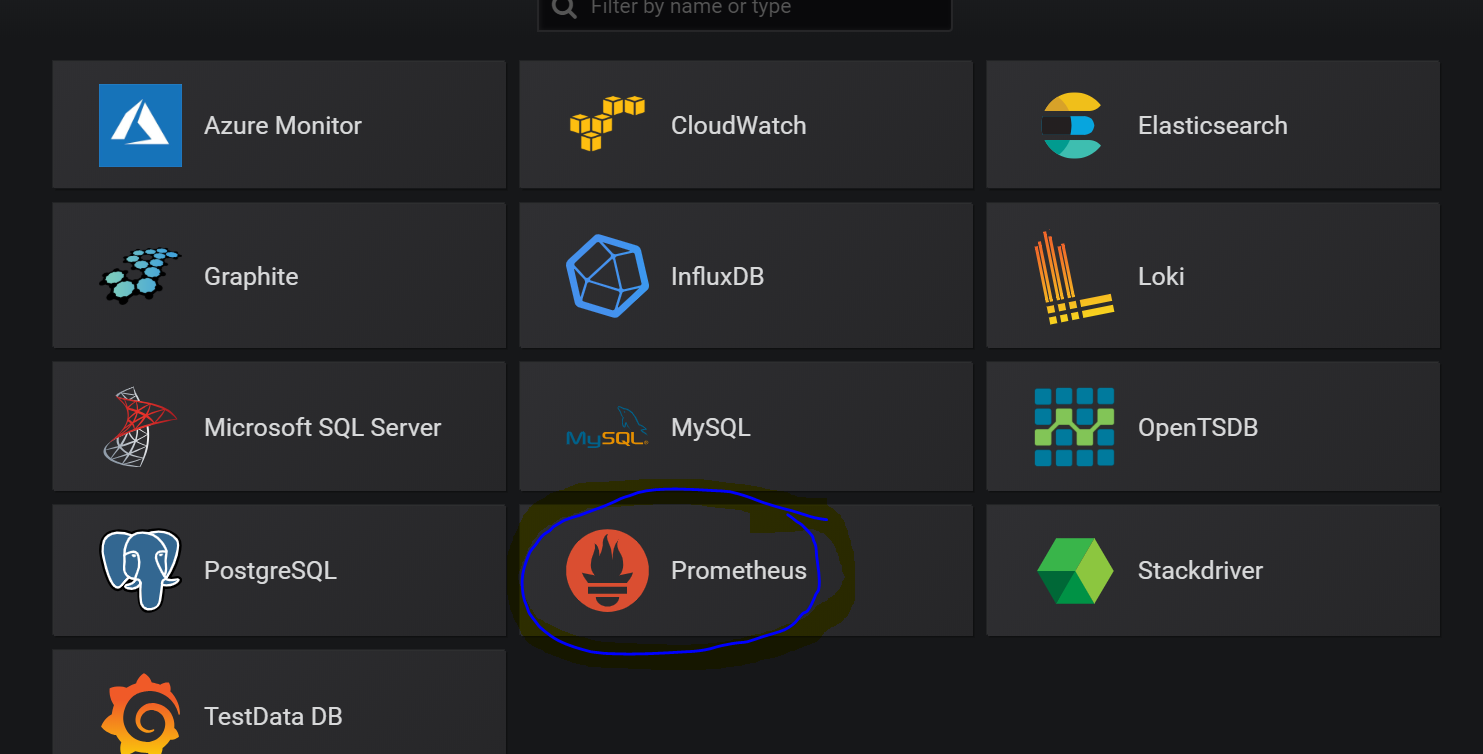
and select prometheus from it :
Give the URL and hit save :

you will see the data source added :

Next we will create a dashboard for Kube Eagle : Import the dashboard: https://grafana.com/dashboards/9871 (Dashboard ID 9871) . Select import dashboard and type 9871 and you should see below :
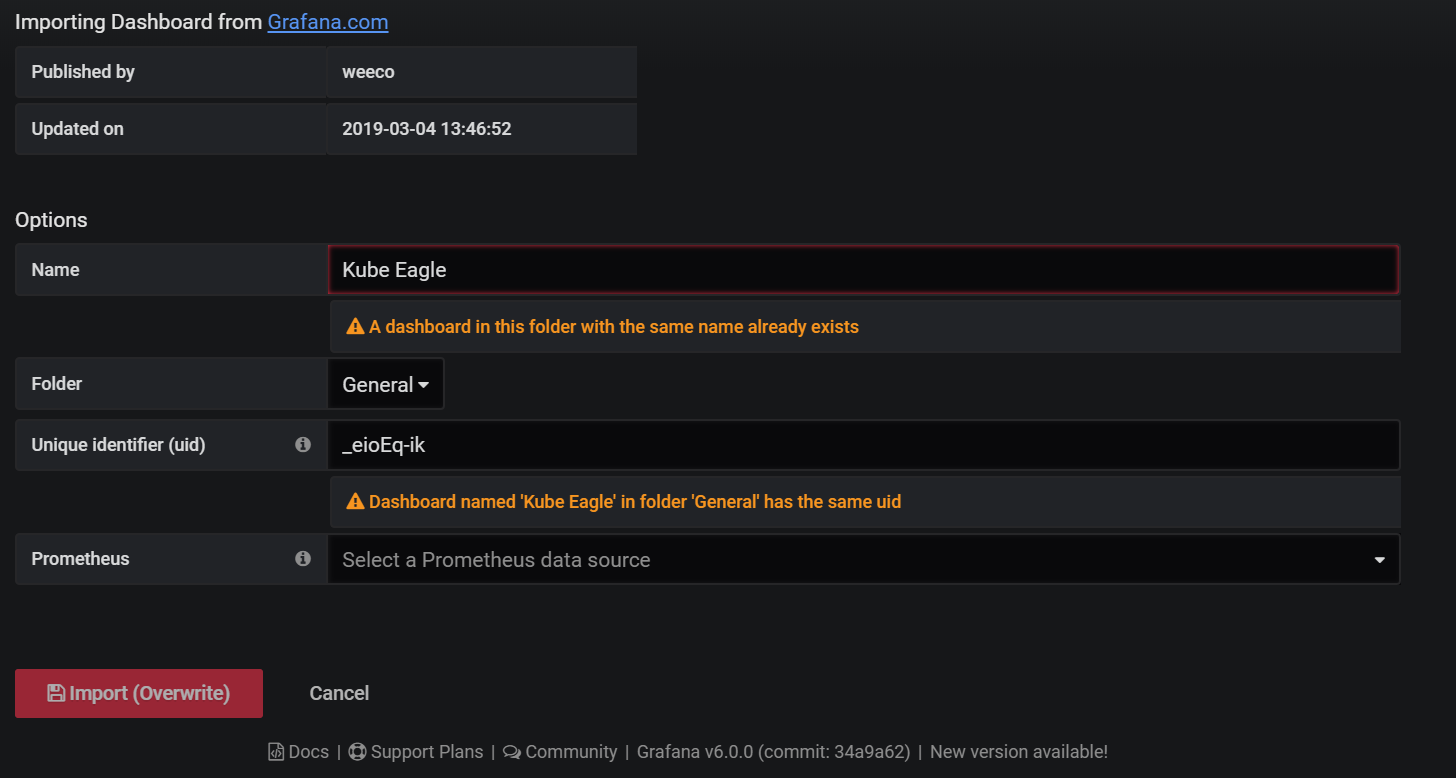
Since I already have Kube Eagle so its showing a warning. If everything is a success till now and you are able to see the respective pods created and running , go to the Kube Eagle dashboard and you should see all the data from the nodes in a much curated manner with granular details and proper aggregation.


As you can see that the Kube-Eagle is setup successfully and is giving lot of useful metrics which can be used to define and limit cores per pod. It actually helps to save lot of hardware resources. Like some pods will run out of ram while the cluster is still having the memory . These kind of issues can be easily visualized using Kube-Eagle.
Martin Schneppenheim who is the creator of Kube Eagle also faced similar issues and built Kube Eagle that helped him and his team cut the cost and lot of other benefits including :
- allocate proper resource requests & limits for micro-services
- reducing the problem of over allocation of RAM
- Balanced Hardware Utilization across all nodes.
Happy Learning. Saiyam Pathak https://www.linkedin.com/in/saiyam-pathak-97685a64/ https://twitter.com/SaiyamPathak